There is a field called systems thinking that reverses the reductive thinking most of us have become accustomed to. Some of its tools can be quite helpful, like this one:
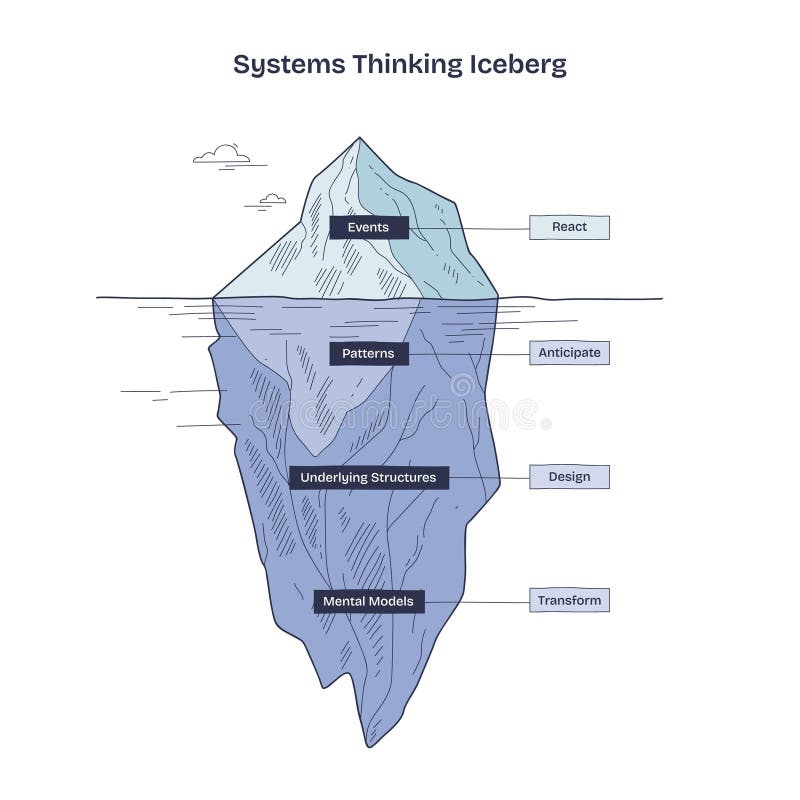
Instead of reacting to events, the iceberg model encourages us to look deeper to get better results. Let’s apply it to the practice of deploying code changes to production for a B2B SaaS company:
- Event: Deployment on January 15th at 7 PM MST to production.
- Pattern: Deployment to production every other Thursday evening.
- Underlying structure (process): After a 2-week sprint ends on Wednesdays, we compile a release and send it to the Change Control Board (CCB) for approval. The CCB convenes on Thursdays. Once approved, we deploy to the demo and production environments during our evening downtime windows on Tuesdays and Thursdays.
- Mental model: Deployments to production are risky, so we deploy outside of business hours, which gives us the time to test and roll back if we find anything wrong, all without impacting customers. But since we don’t like working outside business hours, we can’t do this too often. Aligning with our sprints seems like a good compromise.
Another useful systems thinking tool is a causal loop diagram (CLD), which shows how variables influence a system. Here’s one that visualizes the above mental model:

In a CLD, a + indicates a positive relationship between variables. For instance, deployment risk leads to more desire to deploy outside of business hours. A – indicates a negative relationship. For example, deploying outside of business hours reduces the desire to deploy.
When you visualize a mental model with a CLD, you can better see the assumptions that people make. This helps spot errors and omissions. For instance, deployment frequency is related to deployment risk via the size of the deployed changes:
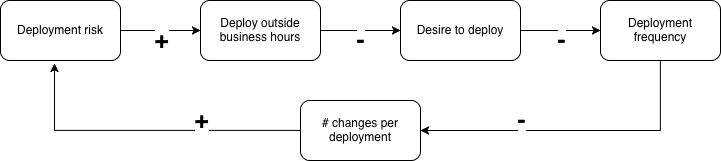
This shows us that, while we set out to reduce deployment risk, the way we did that also ends up increasing it: less frequent deployments lead to more changes per deployment and thus to more risk per deployment. This addition shows why the diagram’s name contains “loop”: most systems contain loops.
It’s hard to tell from a simple diagram like this how conflicting effects combine. The example CLD doesn’t tell us whether the practice of deploying outside business hours actually reduces or increases deployment risk, but at least it begs the question.
Asking questions like that naturally leads to considering alternatives. Can we reduce deployment risk by adding more checks to our test automation? By gathering post-deployment metrics and automatically rolling the deployment back if they are worse than before the deployment? Etc. We can then visualize the (most promising) alternatives in the CLD and pick the best.
Note that with these tools, we no longer have to rely on authority, i.e. what others say are “best practices.” We can add in all the relations that are relevant in our specific context to reach a solution that works best for us, at this time.
As the example shows, systems thinking can help find good solutions to tricky problems. If you’d like to dig further, I can recommend Thinking in systems and Learning systems thinking. Also, try out some of the many tools.
